In the dynamic landscape of entrepreneurship, understanding financial metrics is more than just a skill—it’s a necessity. Entrepreneurs juggle multiple roles, from product development to marketing, but the backbone of sustainable growth lies in their ability to interpret and apply financial data effectively. With startups and small businesses facing high failure rates—approximately 20% within the first year and 50% within five years as reported by the U.S. Bureau of Labor Statistics—grasping the right financial indicators can be the difference between thriving and closing doors.
Financial metrics provide critical insights into a business’s health, guiding strategic decisions, resource allocation, and investment opportunities. This article delves into the essential financial metrics every entrepreneur should know, from profitability ratios to cash flow analysis, illustrated with practical examples and real-world cases to enhance your understanding.

Revenue and Profitability Metrics
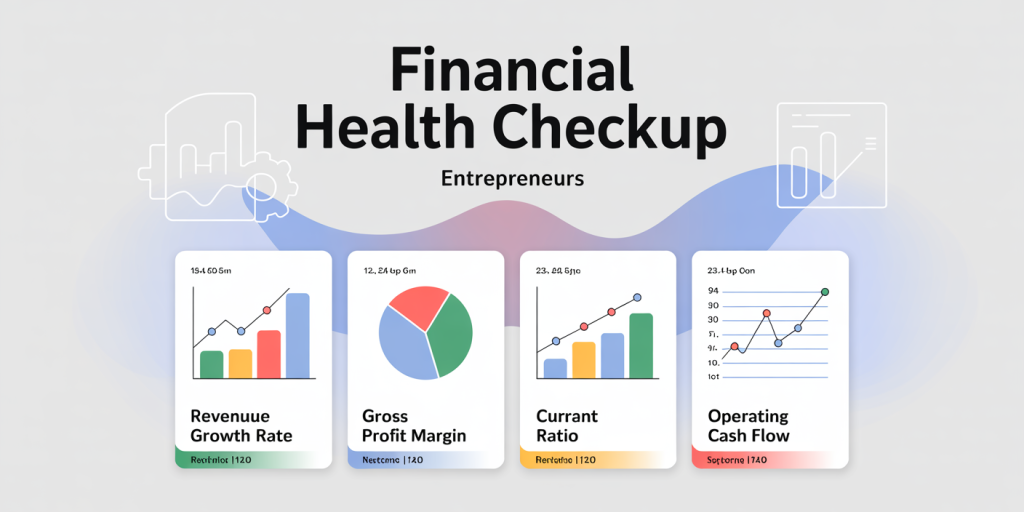
Revenue Growth Rate
Revenue growth rate measures the percentage increase (or decrease) in a company’s sales over a specific period. It is arguably the most straightforward indicator of business expansion and market demand. For an entrepreneur, tracking this metric offers insights into whether products or services are gaining traction.
Consider Tesla, which experienced a revenue growth rate of approximately 45% year-over-year in 2020 amid a global pandemic. This metric signaled strong consumer interest and operational scalability despite challenging external conditions. To calculate revenue growth rate:
\[ \text{Revenue Growth Rate} = \frac{\text{Current Period Revenue} – \text{Previous Period Revenue}}{\text{Previous Period Revenue}} \times 100 \]
For example, if a startup earned $1 million in 2022 and $800,000 in 2021, its revenue growth rate is:
\[ \frac{1,000,000 – 800,000}{800,000} \times 100 = 25\% \]
This positive trajectory encourages further investment and expansion strategies.
Gross Profit Margin
Gross profit margin reflects the percentage of revenue that exceeds the cost of goods sold (COGS). It measures the efficiency of production and pricing strategies. A stable or increasing gross margin indicates good cost control or premium pricing power.
Apple Inc. is a prime example, boasting a gross margin around 38% as of 2023, allowing flexibility in research, development, and marketing expenditures. Conversely, a low or shrinking gross margin may point to rising costs or increased competitive pricing pressure.
| Metric | Formula | Description |
|---|---|---|
| Gross Profit Margin | (Revenue – COGS) / Revenue × 100% | Profit after deducting production costs |
| Net Profit Margin | Net Profit / Revenue × 100% | Overall profitability after all expenses |
For a small business, say a craft brewery, if the revenue per barrel is $500, but the direct costs (ingredients, labor) are $300, the gross profit margin is:
\[ \frac{500 – 300}{500} \times 100 = 40\% \]
This margin provides funds for operational expenses and potential growth.
Liquidity and Cash Flow Analysis
Current Ratio
Liquidity is vital to meet short-term obligations. The current ratio helps entrepreneurs understand their ability to pay off liabilities due within a year using current assets. It is calculated as:
\[ \text{Current Ratio} = \frac{\text{Current Assets}}{\text{Current Liabilities}} \]
A ratio above 1 indicates a healthy liquidity position. For example, a SaaS startup that maintains a current ratio of 2 is generally in a stronger position to cover bills, invest in development, or weather downturns.
Real-life case studies suggest startups with current ratios between 1.5 and 3 experience fewer liquidity crises, translating into operational stability.
Operating Cash Flow
Operating cash flow (OCF) is the cash generated from core business operations, signifying the company’s ability to maintain and grow operations without external financing. Unlike net income, which includes non-cash items like depreciation, OCF provides a more tangible view.
Consider Amazon in its early years, focusing on reinvesting revenue into infrastructure rather than immediate profits. Despite negative net income, positive cash flow from operations signaled potential and sustained investor confidence.
Entrepreneurs should monitor OCF closely to avoid cash crunches that jeopardize payroll, supplier payments, or capital expenditures.
| Liquidity Metric | Ideal Range | Interpretation |
|---|---|---|
| Current Ratio | 1.5 – 3 | Adequate liquidity, too high may indicate inefficient asset use |
| Operating Cash Flow | Positive and growing | Ability to sustain operations internally |
Efficiency Metrics
Inventory Turnover
Inventory turnover reveals how efficiently a business manages stock to meet demand without overstocking or stockouts. It is calculated by:
\[ \text{Inventory Turnover} = \frac{\text{COGS}}{\text{Average Inventory}} \]
A higher turnover ratio suggests effective inventory management. For instance, Walmart is known for its rapid inventory turnover, averaging around 8-9 times per year, enabling fresh product availability and reducing holding costs.
For entrepreneurs in retail or manufacturing, optimizing inventory turnover ensures capital isn’t tied up unnecessarily, helping maintain cash flow.
Accounts Receivable Turnover
This metric evaluates how effectively a company collects payments from customers. It is calculated as:
\[ \text{Accounts Receivable Turnover} = \frac{\text{Net Credit Sales}}{\text{Average Accounts Receivable}} \]
A high turnover ratio indicates prompt collections and strong cash inflow. For example, enterprise software companies often monitor this metric closely. Slack Technologies boosted cash flow by tightening credit terms, increasing AR turnover from 6 to 8 within two years.
Slow turnover can indicate cash flow problems and potentially toxic customer relationships.
Profitability Ratios Every Business Should Track
Return on Investment (ROI)
ROI measures the efficiency of an investment relative to its cost. It helps entrepreneurs assess whether projects or expenditures generate value. Its straightforward formula is:
\[ \text{ROI} = \frac{\text{Net Profit from Investment} – \text{Cost of Investment}}{\text{Cost of Investment}} \times 100 \]
A practical example is a small business investing $10,000 in digital marketing that yields $20,000 in attributable revenue with a profit margin of 20%. The net profit is $4,000 (20% of $20,000), so:
\[ \frac{4,000 – 10,000}{10,000} \times 100 = -60\% \]
This negative ROI may prompt revisiting marketing strategies. By contrast, a positive ROI above 15%-20% is generally considered a strong return in competitive markets.
Net Profit Margin
Net profit margin is the percentage of revenue left after all expenses, taxes, and interest are deducted, reflecting overall company profitability:
\[ \text{Net Profit Margin} = \frac{\text{Net Profit}}{\text{Revenue}} \times 100 \]
For instance, Starbucks reported a net margin of approximately 12% in 2022, reflecting efficient operations despite global economic challenges.
Entrepreneurs should seek to improve net profit margins by reducing costs or increasing prices without sacrificing customer loyalty.
| Profitability Metrics | Typical Industry Ranges (%) | Implications for Entrepreneurs |
|---|---|---|
| ROI | 10 – 30 | High ROI signals effective investments |
| Net Profit Margin | 5 – 15 | Indicates overall profitability |
Debt and Solvency Metrics
Debt-to-Equity Ratio
This ratio compares total liabilities to shareholders’ equity, indicating how much debt a company uses to finance assets. Calculated as:
\[ \text{Debt-to-Equity Ratio} = \frac{\text{Total Liabilities}}{\text{Shareholders’ Equity}} \]
A higher ratio suggests more leverage and financial risk. However, industries like utilities often operate safely with higher debt due to stable cash flows.
For startups, maintaining a low ratio (typically below 1) ensures they are not overleveraged, which is critical when seeking additional investment or bank financing.
Interest Coverage Ratio
This ratio measures the company’s ability to pay interest expenses from its earnings:
\[ \text{Interest Coverage Ratio} = \frac{\text{Earnings Before Interest and Taxes (EBIT)}}{\text{Interest Expense}} \]
An interest coverage ratio below 1.5 might signal insolvency risk. For example, once struggling airline companies improved this metric by restructuring debts to reassure investors during volatile periods.
Entrepreneurs should monitor these debt-related metrics to maintain healthy capital structures and avoid solvency crises.
The Role of Financial Metrics in Future Business Growth
Financial metrics are not static indicators but evolving tools that offer critical foresight into a business’s trajectory. The increasing integration of artificial intelligence (AI) and big data analytics allows entrepreneurs to track these metrics in real-time, anticipate risks and opportunities, and make data-informed decisions faster than ever.
In the next decade, entrepreneurs will benefit more from predictive financial modeling, which uses historical data and financial metrics to forecast performance under various scenarios. For instance, startups can simulate cash flow stresses or investment effects before making costly decisions. Emerging technologies will democratize access to complex financial analyses, supporting entrepreneurs with limited financial expertise.

Moreover, growing trends in environmental, social, and governance (ESG) reporting are prompting entrepreneurs to broaden financial metrics to include sustainability factors. Metrics like carbon footprint efficiency or social return on investment (SROI) are gaining prominence, signaling a paradigm shift toward holistic business performance indicators.

In conclusion, mastering core financial metrics provides entrepreneurs a powerful toolkit for steering their ventures through competitive landscapes and economic uncertainty. Continuous learning and adaptation to new financial technologies and standards will empower entrepreneurs to build resilient, profitable, and forward-looking businesses.

Deixe um comentário