Understanding a Profit & Loss (P&L) statement, also known as an income statement, is a critical skill for business owners, investors, and financial analysts alike. This fundamental financial document summarizes a company’s revenues, costs, and expenses during a specific period, providing insight into the company’s ability to generate profit. Whether you are managing a small startup or analyzing a multinational corporation, mastering the P&L statement can help you make informed decisions, evaluate business performance, and spot areas needing improvement.
Many potential stakeholders overlook the P&L statement’s depth, often only skim-reading the net profit figure. However, a detailed examination reveals much more about operational efficiency, cost management, and revenue trends. This article will guide you through the components of the P&L statement, teach you how to interpret its data, and provide practical examples to enhance your understanding.
Understanding the Structure of a Profit & Loss Statement
The P&L statement is usually divided into several key sections: revenues, costs of goods sold (COGS), gross profit, operating expenses, operating profit, other income and expenses, and net profit. Each section serves a unique purpose and offers insight into distinct areas of business performance.
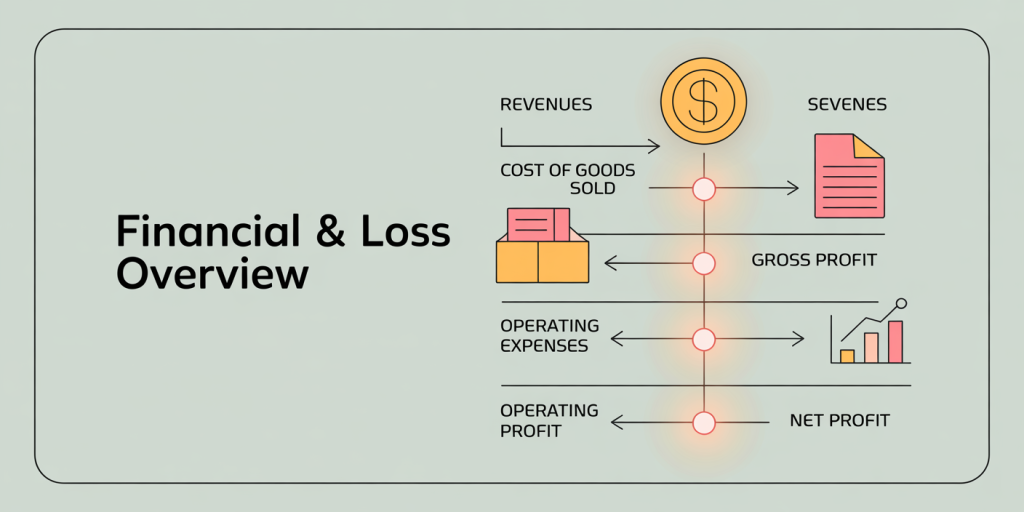
Revenues represent the total income generated from sales of goods or services. For example, if a retail store sells $100,000 worth of apparel in a quarter, this amount is recorded as revenue. Next, COGS reflects the direct costs involved in producing or purchasing the goods sold, such as raw materials or manufacturing labor. Subtracting COGS from revenue results in gross profit.
Operating expenses include costs unrelated directly to production, such as salaries, marketing, rent, and utilities. These expenses are deducted from gross profit to calculate operating profit, which measures the business’s profitability from core activities before financing or tax considerations.
Consider the following simplified example of a seasonal bakery for Q1 2024:
| Item | Amount (USD) |
|---|---|
| Revenue (Sales) | 150,000 |
| Cost of Goods Sold | 60,000 |
| Gross Profit | 90,000 |
| Operating Expenses | 55,000 |
| Operating Profit | 35,000 |
| Interest Expense | 5,000 |
| Net Profit Before Tax | 30,000 |
| Tax Expense (20%) | 6,000 |
| Net Profit | 24,000 |
This table exemplifies how each figure cascades from top-line revenue to bottom-line net profit, illustrating how different expenses erode profitability. In analyzing these numbers, you can investigate which areas are consuming resources excessively or identify trends over different periods.
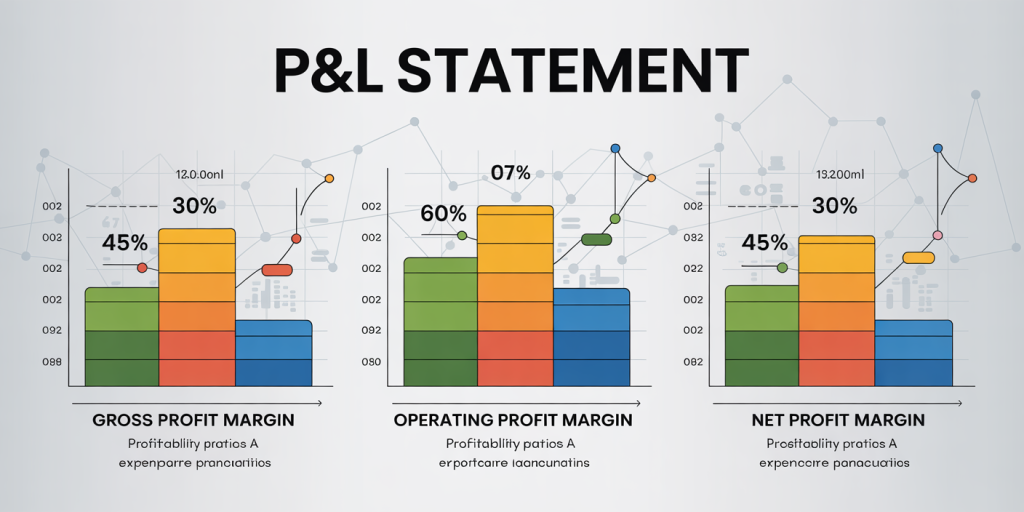
Key Metrics to Evaluate From a Profit & Loss Statement
Once you grasp the basic structure, focusing on key financial metrics within the P&L statement is essential. These ratios and margins help quantify operational efficiency and profitability more objectively.
The Gross Profit Margin is calculated by dividing gross profit by revenue. It indicates how well a company controls production costs relative to sales. For instance, in the bakery example above, gross margin equals 90,000/150,000 = 60%. According to a 2023 report by the National Retail Federation, average gross margins in the food industry hover around 40-60%, positioning this bakery at the higher end of efficiency.
The Operating Profit Margin is operating profit divided by revenue, reflecting how well a company manages operating expenses. In the example, operating margin equals 35,000/150,000 = 23.33%. This metric excludes interest and taxes, offering a clearer reflection of business operations.
Other important ratios include: Net Profit Margin: Net profit divided by revenue, showing overall profitability after all expenses. Expense Ratios: Comparing individual expenses (e.g., marketing, salaries) to revenue explains cost structure. For instance, if this bakery’s marketing expenses were $10,000, that constitutes approximately 6.67% of revenue. Retail industry standards suggest marketing expenses typically range between 5-10%, meaning this bakery is within the usual range.
Tracking these margins over multiple periods helps identify whether profitability is improving or declining, enabling early corrective measures.
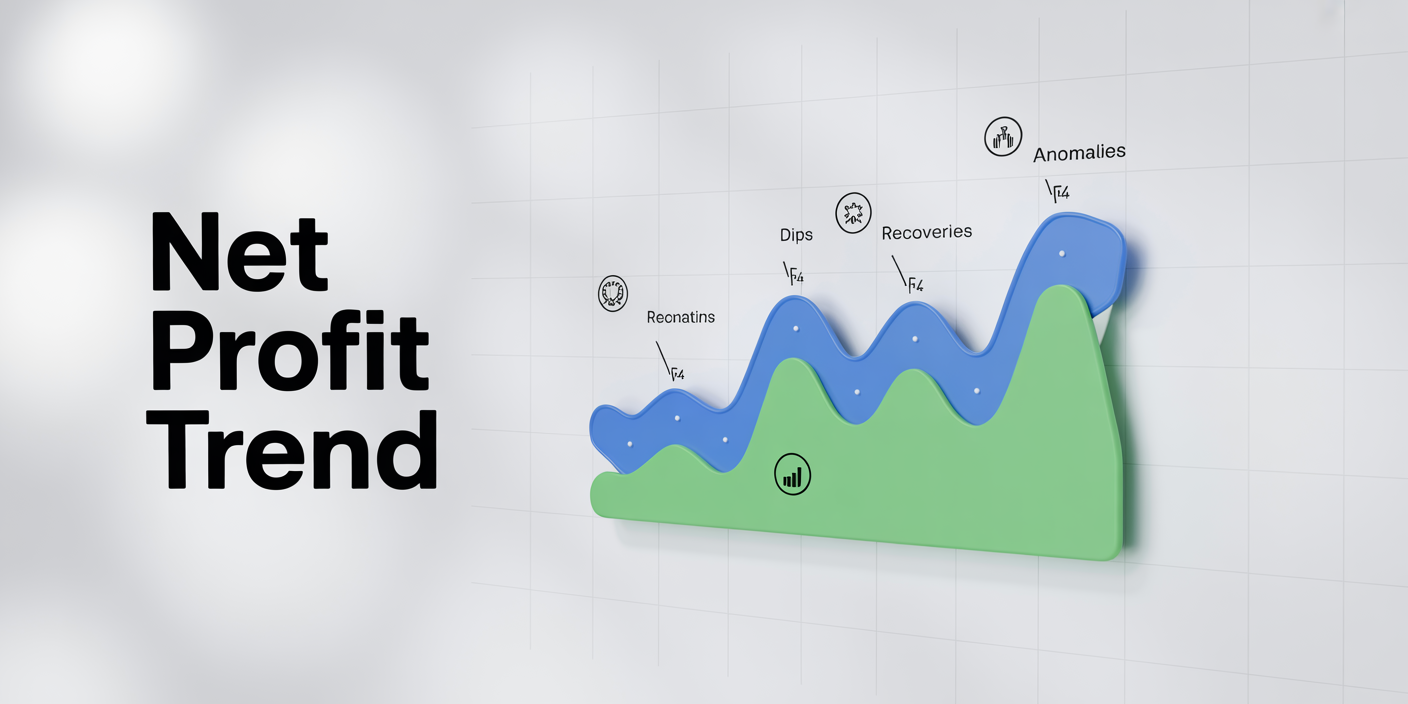
How to Spot Trends and Anomalies in the Data
Beyond individual metrics, analyzing trends over time enhances your understanding of a business’s financial trajectory. Comparing P&L statements across quarters or years can spotlight growth patterns, cost escalations, or seasonal impacts.
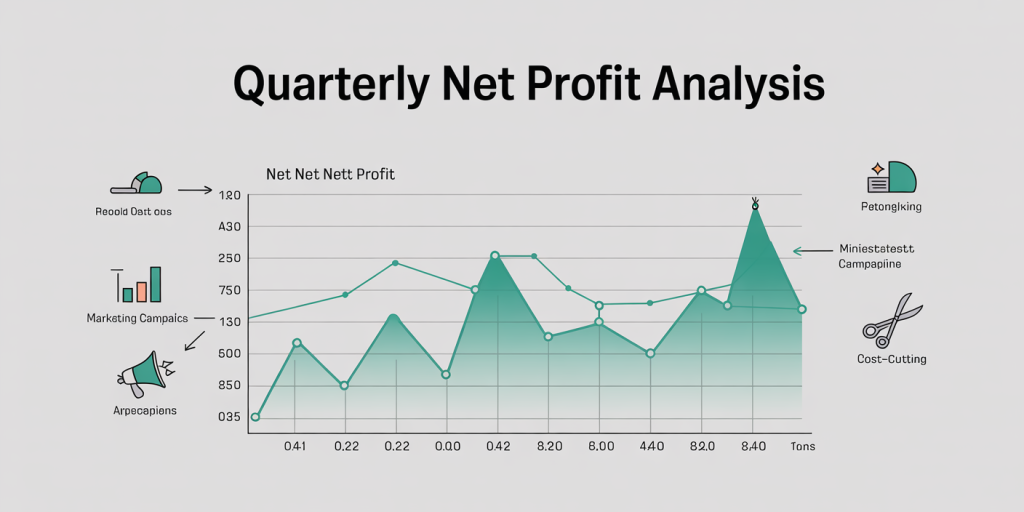
Suppose the bakery experienced the following net profit changes over three quarters:
| Quarter | Net Profit (USD) | Change (%) |
|---|---|---|
| Q3 2023 | 20,000 | — |
| Q4 2023 | 18,000 | -10% |
| Q1 2024 | 24,000 | +33.33% |
This table reveals a dip in Q4 potentially due to holiday season competition or increased costs, followed by a strong recovery in Q1. Investigating related documents or business activities can confirm causes — for example, whether a marketing campaign or cost-cutting measure coincided with these shifts.
Anomalies such as sudden spikes in expenses or revenues can also indicate accounting errors, one-time events, or changes in business strategy. For example, a surge in “Other Income” might reflect gains from asset sales or investments rather than regular operations.
Tools like variance analysis compare actual results against budgets or forecasts. If actual COGS exceeded budget by 15%, management might review supplier contracts or production efficiencies.
Practical Examples From Real Companies
To better illustrate reading a P&L statement, consider publicly available data from actual companies. Apple Inc.’s 2023 fiscal year report shows:
| Item | Amount (Billion USD) |
|---|---|
| Revenue | 394.3 |
| Cost of Goods Sold | 223.5 |
| Gross Profit | 170.8 |
| Operating Expenses | 43.3 |
| Operating Income | 127.5 |
| Net Income | 99.8 |
Apple reported a gross margin of approximately 43.3% and an operating margin of about 32.4%, reflecting efficient cost management despite high production volumes. Here, investors often focus on margin improvement as a signal of competitive advantage, especially given large-scale supply chain challenges.
Conversely, a small tech startup might report the following for Q2 2023:
| Item | Amount (USD) |
|---|---|
| Revenue | 500,000 |
| Cost of Goods Sold | 200,000 |
| Gross Profit | 300,000 |
| Operating Expenses | 400,000 |
| Operating Income | -100,000 |
| Net Income | -120,000 |
Despite generating gross profit, the startup operates at a loss due to high operating expenses associated with R&D and marketing aimed at growth. This scenario is typical for early-stage companies prioritizing market penetration over immediate profitability. Understanding such P&L details informs decisions on fundraising, scaling, or pivoting.
Common Mistakes to Avoid When Analyzing P&L Statements
Errors in interpreting P&L statements can lead to misguided business decisions. One common mistake is focusing solely on net profit without considering cash flow implications. A company may show a strong net profit but suffer from cash shortages due to receivables or inventory buildup.
Another pitfall is ignoring non-recurring items. For instance, a large one-time expense or gain could distort typical profitability. These should be adjusted to evaluate ongoing operations accurately.
Comparing P&L statements across companies without normalizing for size, industry, or accounting practices can also mislead. For example, software firms typically have lower COGS but higher operating expenses compared to manufacturing companies.
Business owners must also keep in mind the accrual accounting basis commonly used, reflecting revenues earned and expenses incurred regardless of cash transactions. This sometimes conflicts with real-time cash availability.
Looking Ahead: The Evolving Role of Profit & Loss Statements
As financial reporting evolves, so too does the utility of P&L statements in decision-making. Advances in technology enable real-time financial analytics, allowing businesses to track performance continuously rather than waiting for quarterly or yearly statements.
Moreover, environmental, social, and governance (ESG) factors are prompting companies to expand profit and loss analysis beyond financial metrics. Some firms now incorporate social impact costs or carbon pricing into operational expenses, enriching traditional P&L data.
Artificial Intelligence (AI) and machine learning models are beginning to analyze P&L patterns for predictive insights, forecasting future profitability and flagging risks proactively.
For businesses aiming to maintain competitive advantage, regularly updating the P&L with forward-looking adjustments—like anticipated expenses or potential revenue streams—is becoming standard practice.
In summary, mastering how to read a Profit & Loss statement empowers stakeholders to gain a comprehensive view of business health. It facilitates deeper financial literacy, improves decision-making, and positions companies to react agilely to market conditions and internal challenges. By combining foundational knowledge of its components with trend analysis and practical application, you can unlock the full potential of the P&L as a management and investment tool.
Deixe um comentário