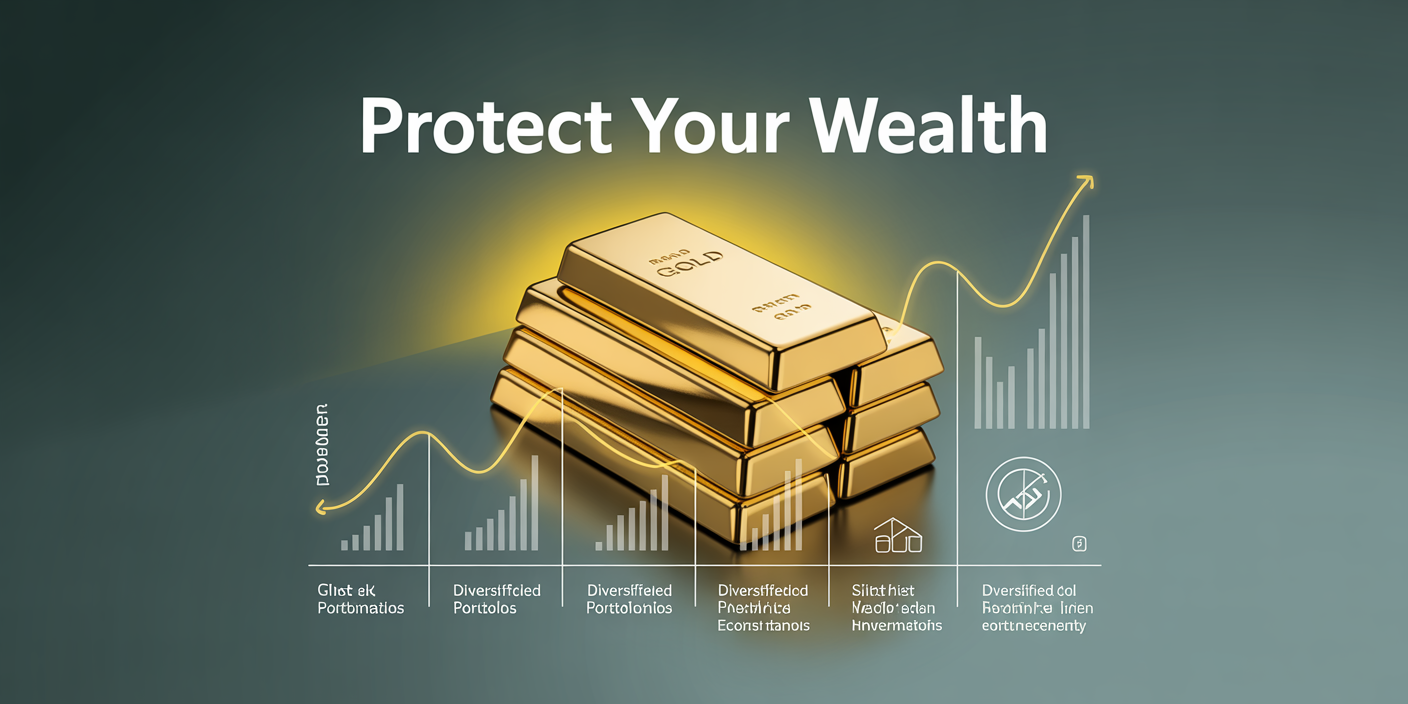
In the modern investment landscape, managing risk is as crucial as seeking returns. Portfolio protection has become a fundamental aspect of investment strategy, particularly in volatile markets. Derivatives, financial instruments whose value is derived from underlying assets, offer powerful tools for hedging and mitigating potential losses. These instruments allow investors to guard against adverse movements, balancing risk while striving for optimal performance. Understanding how derivatives function and their practical applications in portfolio protection is essential for both institutional and individual investors.

In this article, we explore the pivotal role derivatives play in safeguarding portfolios. We analyze different types of derivatives, showcase real-world applications, compare various protective strategies, and look ahead to how evolving markets might shape the role of derivatives in portfolio risk management.
—
Understanding Derivatives and Their Protective Functions
Derivatives encompass a wide array of contracts including options, futures, forwards, and swaps. Each serves unique functions in the context of portfolio protection. At their core, derivatives allow investors to transfer or hedge risks associated with price fluctuations in stocks, bonds, commodities, currencies, or interest rates.
Options are among the most common protective derivatives. A put option, for instance, gives the holder the right, but not the obligation, to sell an underlying asset at a predetermined price within a specified time. This right effectively caps the potential loss of an asset, acting like insurance for the portfolio. Similarly, futures contracts obligate parties to transact an asset at a fixed price on a future date, allowing hedgers to lock in prices and reduce exposure to volatility.
While derivatives can be complex, their protective utility lies in their ability to create asymmetric payoffs—limiting downside while allowing upside potential. According to data from the Options Clearing Corporation, the use of equity options for hedging increased by over 40% between 2018 and 2023, reflecting growing investor awareness of their protective benefits.
—
Real-World Applications of Derivatives in Portfolio Protection
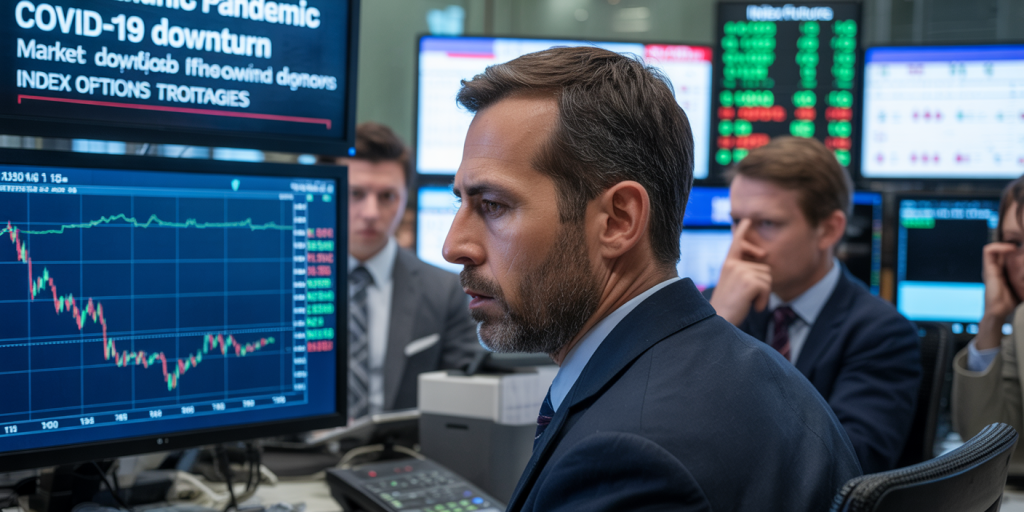
A practical example of derivatives in action can be seen during the 2020 stock market upheaval caused by the COVID-19 pandemic. Many portfolio managers used put options and index futures to hedge against rapid market declines. BlackRock, one of the world’s largest asset managers, disclosed in its annual report that it increased its use of options strategies to mitigate downside risk during early 2020, avoiding significant losses when the S&P 500 dropped by over 30% in less than a month.
Retail investors also benefit from derivatives-based protection strategies. For example, purchasing put options on specific stocks or ETFs during periods of anticipated volatility can limit downside without the need to sell holdings outright. This approach preserves long-term gains while creating a financial buffer against sudden downturns.
In commodity markets, hedgers often use futures contracts to stabilize revenue streams. Airlines, susceptible to fluctuating fuel prices, commonly engage in fuel futures contracts to lock in prices and protect against spikes that could erode profitability. Such strategies demonstrate how derivatives are crucial not only in financial portfolios but across varied asset classes.
—
Comparing Derivative Strategies for Different Risk Profiles
Investors with varying risk tolerances and portfolio aims can leverage derivatives in distinct ways. Below is a comparative table outlining commonly used derivatives in portfolio protection, highlighting their features and suitability for different investor profiles:
| Derivative Type | Protective Mechanism | Risk Profile | Advantages | Disadvantages |
|---|---|---|---|---|
| Put Options | Right to sell at strike price | Moderate to high risk | Defined loss, unlimited upside | Premium cost reduces returns |
| Futures | Obligation to buy/sell at price | Low to moderate risk | Lock prices, no upfront premium | Potential for margin calls |
| Credit Default Swaps (CDS) | Transfer default risk | High risk (mostly institutional) | Customizable credit protection | Complexity, counterparty risk |
| Protective Collars | Combination of puts and calls | Moderate risk | Cost-effective, limits losses | Caps upside potential |
Put options are excellent for investors who want defined downside protection and are willing to pay a premium. Futures suit those with the capacity to manage margin requirements and who seek to lock in prices quickly. Credit default swaps, often used by institutional investors, provide a hedge against credit events but involve intricate contracts and counterparty considerations.
Protective collars combine buying puts and writing call options, thereby reducing the premium cost of the put by capping the upside through the call. This strategy is popular among investors aiming for cost-effective protection over shorter timeframes.
—
Statistical Evidence on Derivative Effectiveness in Portfolio Protection
Empirical research consistently supports the effectiveness of derivatives in mitigating portfolio risk. A study published by the CFA Institute in 2022 examined the performance of portfolios utilizing options-based hedging strategies versus unhedged counterparts during market downturns from 2000 to 2020. Results showed that portfolios employing put options exhibited a 25% lower maximum drawdown on average compared to unprotected portfolios, while maintaining competitive returns during bull markets.
Additionally, data from the Chicago Mercantile Exchange (CME) highlight increased open interest in futures and options contracts during periods of heightened volatility, as measured by the VIX index. For example, during the 2008 financial crisis, S&P 500 futures trading volume surged by 60%, underscoring that investors turned to derivatives to manage unprecedented risk.
Careful application is critical, however. Misuse or overreliance on derivatives can amplify losses, especially if markets move contrary to hedging positions. Thus, prudent risk management, timing, and understanding of the underlying assets remain paramount.
—
Case Study: Portfolio Protection Using Options during the Tech Bubble Burst
The dot-com bubble burst in the early 2000s provides a case study of derivatives in portfolio protection. Throughout the late 1990s, investors heavily exposed to technology stocks suffered substantial losses as NASDAQ Composite Index fell nearly 78% from peak to trough between 2000 and 2002.
However, some professional managers who purchased put options on NASDAQ-100 ETFs or used index futures to hedge their equity exposure mitigated these losses significantly. According to data from Morningstar, a portfolio protected with a 5% out-of-the-money put option during this period would have limited its maximum drawdown to approximately 40%, compared to the index’s 78% loss.
Similarly, institutional investors often layer derivative strategies with diversified asset allocations to protect capital without liquidating long-term holdings. These historical examples validate derivatives as not mere speculative tools but crucial components in protecting wealth during market stress.
—
Future Perspectives: The Evolution of Derivatives in Portfolio Protection
The future of derivatives in portfolio protection is poised for transformation, driven by technological advances, regulatory shifts, and evolving market dynamics. Artificial intelligence (AI) and machine learning are increasingly integrated into risk modeling, enabling more precise and dynamic hedging strategies. These advancements allow portfolios to be protected with derivatives tailored in real time to market conditions and investor goals.
Green finance and sustainable investing present new frontiers as well. Derivatives based on environmental, social, and governance (ESG) indices are gaining traction, offering innovative means to hedge portfolios aligned with sustainability goals. According to the Global Sustainable Investment Alliance, sustainable assets reached $40.5 trillion in 2022, highlighting a growing marketplace for ESG-linked derivatives.

Regulatory frameworks, though complex, are becoming more transparent, facilitating broader investor participation in derivative markets while aiming to reduce systemic risk. The rise of decentralized finance (DeFi) platforms further suggests potential for novel derivative instruments accessible to a wider audience, democratizing portfolio protection tools.
Despite these promising developments, investors must navigate challenges such as liquidity constraints in niche products and the sophistication required for effective implementation. Ongoing education and collaboration between financial institutions, regulators, and technology providers will shape the future effectiveness and accessibility of derivative-based portfolio protection.
—
Derivatives have indisputably become essential tools in the arsenal of portfolio risk management. From traditional options and futures to emerging ESG-linked contracts, their ability to hedge downside risk, stabilize returns, and enhance strategic flexibility offers investors a pathway to navigate an uncertain financial environment. As markets evolve, so too will the role of derivatives, underscoring their enduring importance in the quest for both growth and protection.